# wiki-usage
Generate usage stats on a mediawiki site, specically outputting the following 3 figures.
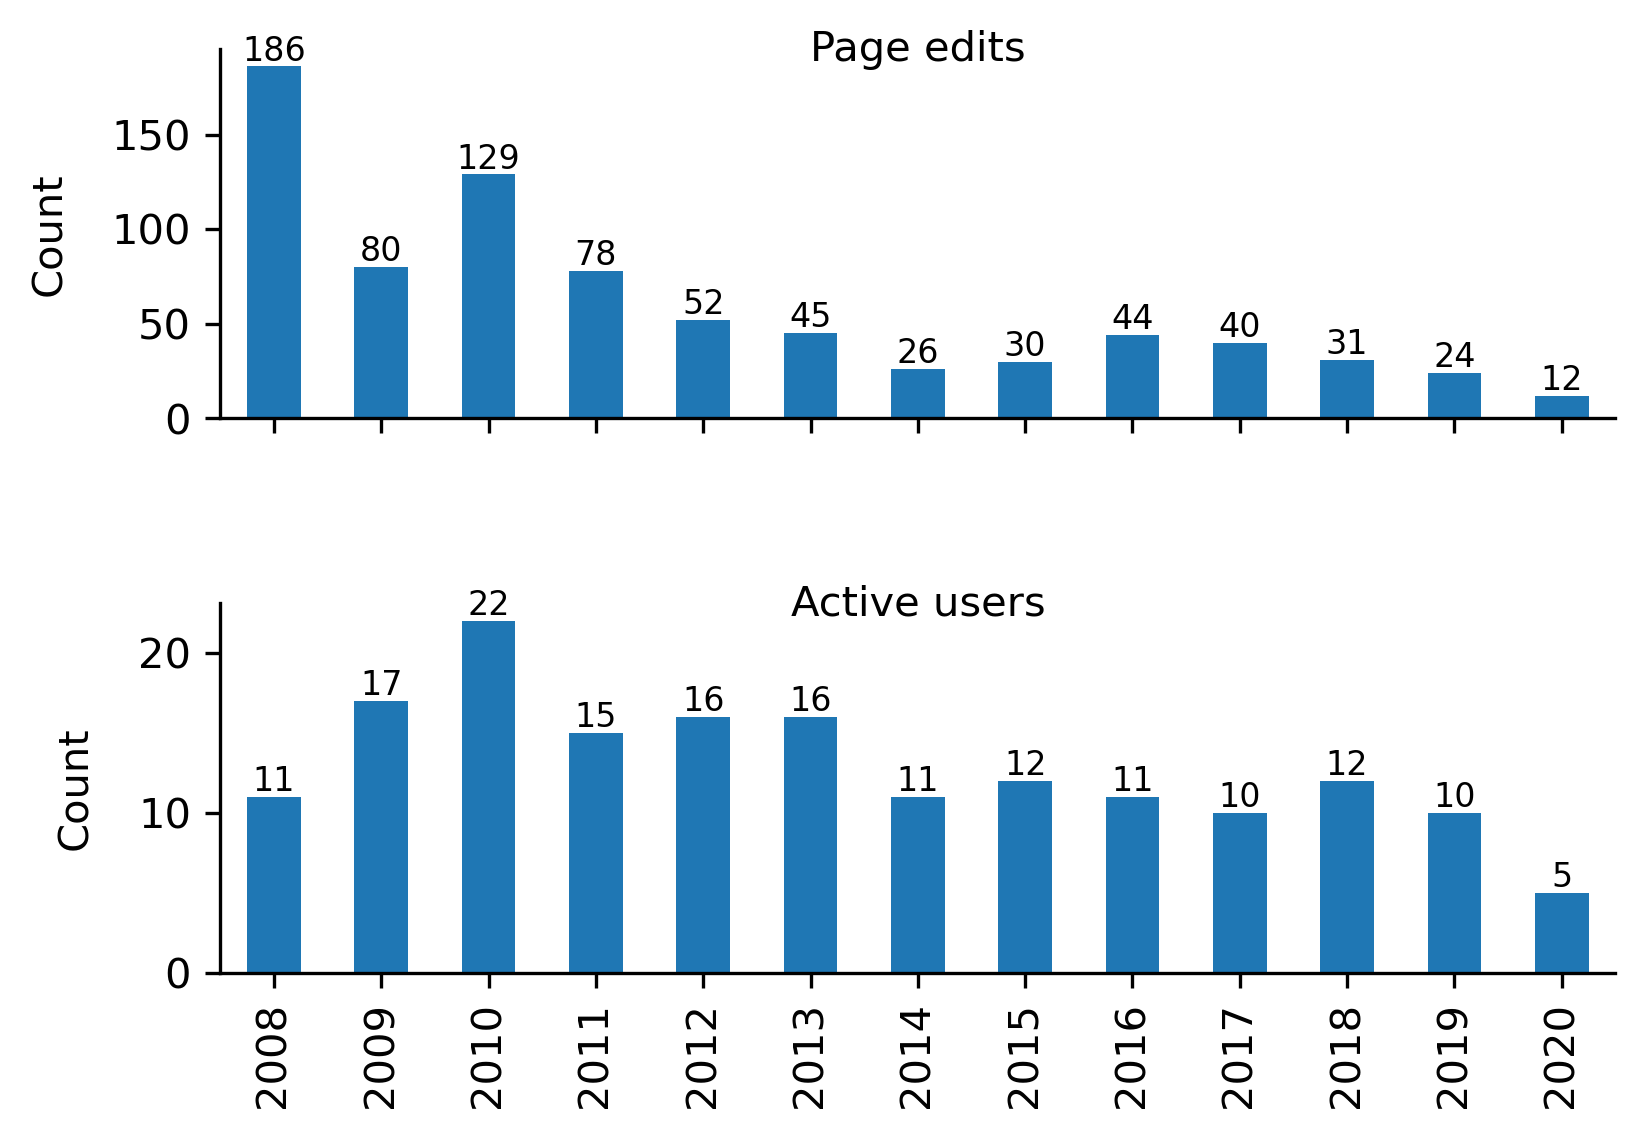
1. Bar chart showing page edits and active users per year
2. Table showing user contributions per user over the past 5 years
3. Table showing page edits over the past 3 years
Note, 'page edits' in the bar chart only shows the number of unique pages that have been edited. For example if mutliple users make multiple edits to a page, that page edit tally will still just be 1. Conversely, the user contributions table includes all unique edits to a page per day. For example, if a user makes 3 edits to the same page on three different days, the user contribution tally will be 3.
## Usage
1. Go to this wiki page:
<https://wiki.wrl.unsw.edu.au/index.php?title=Special:AllPages>
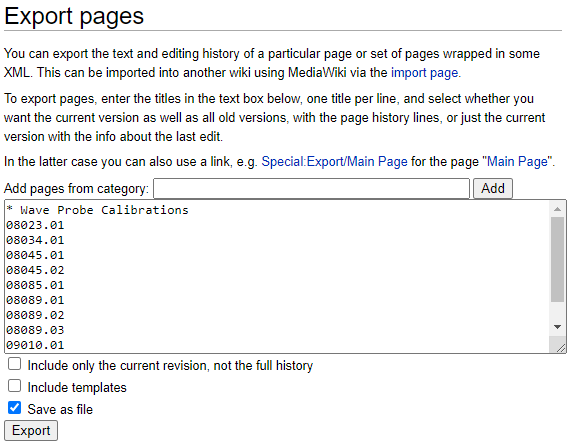
2. Highlight all the pages then copy/paste the list of page titles in the "Add pages manually" text box here: https://wiki.wrl.unsw.edu.au/index.php/Special:Export. Note, you'll need to click Next Page to copy/paste ALL of the pages.
3. Uncheck the box 'Include only the current revision, not the full history' and check the box 'Save as file'
4. Click export.
5. Move the downloaded xml file into the same folder as `wiki-stats.py`,
6. Update the filepath to this .xml in the script. You may also need to update the list of project engineers. Then run it with `python wiki-stats.py`. The 3 figures will be output in a folder called `<YEAR>_Figures`
## Sample output